BMI Explained: What Your Number Really Means (and When Not to Trust It)
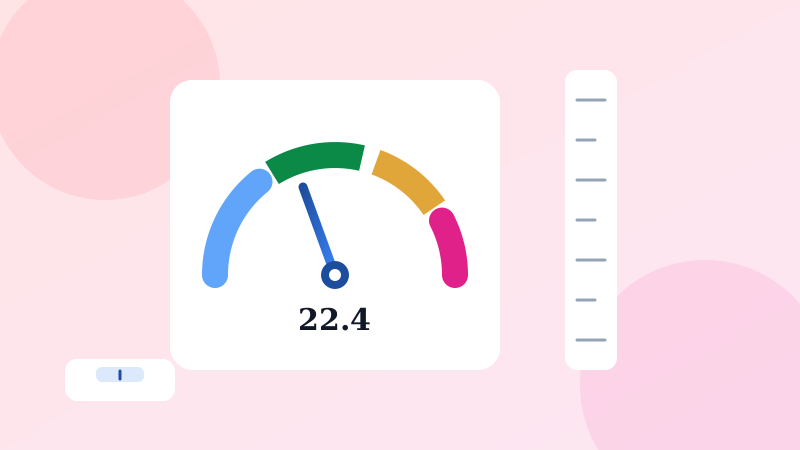
Body Mass Index might be the most famous number in all of health. Doctors record it at nearly every visit, insurance forms ask for it, fitness apps calculate it automatically, and our own BMI Calculator is among the most used tools on this site. It is also, by a comfortable margin, the most misunderstood number in health — routinely treated as a verdict on a person's body when it was never designed to judge any individual at all. This post is the full story: where BMI came from, what the formula actually measures, what the categories mean, the four big blind spots everyone should know about, and — most usefully — how to read your own number in a way that informs you instead of misleading you.
The formula: two measurements and one division
BMI is almost embarrassingly simple. Take your weight in kilograms and divide it by your height in metres, squared: BMI = kg ÷ m². Someone who is 1.75 m tall and weighs 70 kg has a BMI of 70 ÷ (1.75 × 1.75) ≈ 22.9. If you think in pounds and inches, the same calculation uses a conversion constant: weight in pounds divided by height in inches squared, multiplied by 703. Our calculator accepts both unit systems, does the arithmetic instantly in your browser, and shows which category the result falls into — and if you ever need to convert units on their own, the Unit Converter handles kilograms, pounds, metres and feet with exact factors.
Notice what the formula contains: weight and height. Nothing else. No body-fat percentage, no waist measurement, no muscle mass, no age, no fitness level, no bloodwork. Every strength and every weakness of BMI flows directly from that fact. It measures how heavy you are for your height — full stop. Everything else people read into the number is inference, and the quality of that inference varies enormously depending on who you are.
Where BMI actually came from
The formula is nearly two centuries old, and it wasn't invented by a doctor. Adolphe Quetelet was a Belgian astronomer and statistician working in the 1830s and 1840s who became fascinated with applying mathematics to human populations — he practically founded the field of social statistics. While studying how human weight varies, he observed that among adults, weight tends to scale roughly with the square of height, and he proposed weight-over-height-squared as a way to characterize the build of populations. It was called the Quetelet Index, and it was a tool for describing groups of people, not diagnosing individuals.
The formula lived in relative obscurity until the twentieth century, when life insurance companies — who had a financial interest in predicting mortality — built weight-for-height tables and noticed that policyholders far above the typical weight for their height died earlier on average. Researchers needed a standard way to express "weight relative to height," and in 1972 the physiologist Ancel Keys published a study comparing the available formulas, found Quetelet's the best of the simple options, and renamed it the Body Mass Index. Keys himself was explicit about its purpose: it was appropriate for population studies and inappropriate for individual evaluation. That warning, from the man who named the index, has been largely forgotten in the fifty years since — which is exactly why posts like this one need writing.
The categories: what the WHO bands mean
The thresholds our calculator reports come from the World Health Organization and are used in research worldwide: below 18.5 is classed as underweight, 18.5 to 24.9 as normal weight, 25 to 29.9 as overweight, and 30 and above as obese (with obesity further subdivided into classes I, II and III at 30, 35 and 40). These cut-points weren't handed down from first principles — they're round numbers chosen because, across large populations, the statistical risk of conditions like type 2 diabetes, cardiovascular disease and some cancers begins climbing meaningfully in the ranges above 25 and especially above 30, while very low BMI correlates with its own set of risks, from malnutrition to osteoporosis.
The key phrase in that sentence is across large populations. A threshold that cleanly separates risk groups when you average a hundred thousand people does not cleanly separate anything for one person. Crossing from 24.9 to 25.1 does not change your body or your health on that Tuesday; it changes which statistical bucket a researcher would place you in. Treating the category boundary as a personal cliff edge is the single most common misreading of BMI.
Why such a crude number refuses to die
Given the criticism BMI attracts, it's fair to ask why medicine still uses it at all. The answer is that BMI is spectacularly cheap and consistent. It requires a scale and a tape measure — equipment available in every clinic on Earth — takes thirty seconds, needs no training to compute, and produces the same number in Lagos, Lima and London. For tracking obesity trends across decades, comparing populations between countries, and screening large groups quickly, those properties are priceless. Body-fat scanning is more accurate for individuals, but you cannot DEXA-scan a nation. BMI persists because at the population level, where it was born, it genuinely works: it correlates well enough with body fat, and with health outcomes, to be a useful epidemiological instrument. The trouble only starts when a population instrument gets pointed at one human being.
Blind spot one: muscle and fat weigh the same
A kilogram of muscle and a kilogram of fat both register as one kilogram on the scale, and BMI cannot tell them apart. Muscle is considerably denser than fat, so muscular people carry more weight per unit of volume — which is why strength athletes, rugby players and sprinters routinely land in the "overweight" or even "obese" BMI bands while carrying less body fat than the average "normal weight" office worker. The reverse error is quieter but just as real: a sedentary person with little muscle can sit comfortably in the normal band while carrying an unhealthy amount of body fat — a pattern researchers sometimes call normal-weight obesity. If you strength-train seriously, expect your BMI to read high and know that the number is registering your muscle; if you're light but soft, don't let a "normal" reading close a conversation your body composition might want to have.
Blind spot two: where the fat sits matters more than how much
Two people with identical BMIs can carry fat in very different places, and medically, location matters enormously. Visceral fat — the kind packed around the abdominal organs — is metabolically active and strongly associated with insulin resistance, cardiovascular disease and inflammation. Subcutaneous fat carried on the hips and thighs is comparatively benign. BMI is blind to the difference: the classic "apple" and "pear" body shapes can produce the same index while carrying quite different risk profiles. This is why clinicians increasingly pair BMI with a simple waist measurement, and why the section on companions below may be more practically useful than the BMI number itself.
Blind spot three: age and sex shift the picture
The standard bands are calibrated for adults and applied identically to a 25-year-old and a 75-year-old, which papers over real physiology. As people age, muscle naturally declines (sarcopenia) and fat tends to rise, so an older adult can hold a steady, "healthy" BMI while their body composition quietly deteriorates — the index sees no change because the scale sees no change. There's also evidence that for older adults, slightly higher BMI is not associated with the same risks as in the middle-aged, and being underweight becomes the more dangerous end of the scale. Sex matters too: at any given BMI, women typically carry a higher percentage of body fat than men — the index was never adjusted for the difference. None of this makes BMI useless with age; it makes the same number mean different things at different life stages, which a single set of bands cannot express.
Blind spot four: one set of cut-points for all of humanity
The 18.5/25/30 thresholds were derived largely from studies of European-descent populations, and they travel imperfectly. The clearest example: substantial research shows that people of South and East Asian descent tend to develop type 2 diabetes and cardiovascular risk at lower BMIs than the standard bands suggest, carrying more visceral fat at the same index value. The WHO has acknowledged this, noting additional "action points" at 23 and 27.5 for Asian populations where health risk already rises. Meanwhile some other groups show risk beginning at higher thresholds. Our calculator reports the standard WHO bands because they remain the global reference — but if your ancestry is Asian, it's worth knowing that many clinicians would read a 24 differently for you than the label "normal" implies, and that's a conversation for a doctor, not a calculator.
Better companions: cheap measurements that fill the gaps
You don't need a lab to improve on BMI — a tape measure covers a surprising amount of its blindness. Waist circumference directly targets blind spot two: common guidance flags elevated risk above roughly 102 cm (40 in) for men and 88 cm (35 in) for women. Even simpler is the waist-to-height ratio, with its memorable rule of thumb: keep your waist under half your height. Because it scales with your frame, it works across short and tall people better than a fixed waist number. Body-fat percentage — from calipers, smart scales, or a DEXA scan — addresses blind spot one directly, though home methods have real error margins of their own. The honest summary is that no single number captures a body; two or three cheap numbers together sketch a far more truthful picture than any one of them alone. BMI works best not as a verdict but as one witness among several.
How to read your own number sensibly
Here is the workflow we'd actually suggest. First, compute your BMI in the calculator and note the category — as a rough flag, nothing more. Second, add context the formula can't see: do you strength-train, where do you carry weight, how old are you, what's your ancestry? Adjust your reading of the number accordingly using the blind spots above. Third, prefer the trend to the snapshot: a BMI drifting steadily upward over two years says more than any single reading, because the trend cancels out your personal build — you are being compared with yourself. Fourth, remember that day-to-day scale weight swings a kilogram or two on water, salt and timing alone, so weigh under consistent conditions and think in weekly averages. And fifth, if the number worries you — or contradicts how you feel — take it to a professional who can measure what BMI can't. A calculator can start that conversation; it cannot finish it.
A note on children and teens
One firm boundary: the adult bands do not apply to anyone still growing. Children's healthy weight-for-height changes continuously with age and differs by sex, so pediatric assessment uses BMI-for-age percentile charts, where a child is compared against reference curves for their exact age and sex rather than fixed cut-offs. Our calculator, like most online BMI tools, implements the adult formula and categories — please don't use it to evaluate a child. That's a job for a pediatrician with the proper growth charts.
Three myths worth retiring
"A high BMI always means poor health." Not always — muscular builds read high, and a minority of people with obese-range BMIs show healthy metabolic markers. The population-level risk association is real; the individual guarantee is not. "A normal BMI means you're fine." Also no — normal-weight individuals can carry excess visceral fat and poor metabolic health that the index cannot see. "BMI was designed as a personal health target." It never was. Quetelet built it to describe populations, Keys endorsed it for research and explicitly not for individuals, and its migration into personal scorekeeping happened through convenience, not evidence. Knowing that history is half the protection against misusing the number.
Where to go from here on this site
If BMI is your starting point, several neighboring tools continue the picture. The Calorie Needs Calculator estimates your daily energy budget using the Mifflin-St Jeor equation, and the Macro Calculator splits any calorie target into protein, carbohydrate and fat grams. The Ideal Body Weight Calculator deliberately shows three published formulas side by side — the spread between them is an honest error bar on the whole idea of a single "ideal" number. And the Heart Rate Zone Calculator turns exercise intent into practical intensity bands. Every one of them states its formula and its limitations on the page, in the same spirit as this post — we covered the whole family of these tools in What Fitness Calculators Really Tell You.
Privacy, and the disclaimer that isn't boilerplate
Like every tool on ComeTool, the BMI calculator runs entirely in your browser: your height and weight are never transmitted, logged or stored anywhere. Health numbers are personal, and estimates should be nobody else's business. And to say it plainly one final time: nothing here is medical advice. BMI is a screening statistic with known, well-documented limits; pregnancy, medications, chronic conditions and a dozen other realities change what any number means for you. Use the calculator to get informed, use this post to get skeptical in the right ways, and use a qualified professional for decisions about your health — they have access to the one dataset no population formula ever will: you.